
Page 5 - Logistics News - Issue 01 - 2024.indd
P. 5
D ATA D A S HB O ARDS
Why choose to implement data dashboards? Best practices to implement data dashboards
Data dashboards have an immediate and tangible impact on an The best data dashboards answer important questions about
operations environment. Key examples are: your business. Unlike advanced business intelligence tools,
• Continuous tracking of business performance (KPIs) at all dashboards are designed for quick analysis and informational
levels. awareness. The following best practices will ensure that the
• Guiding focused improvement and accurate prioritisation. implementation of dashboards in an operations environment
• Efficient problem-solving. sustainably delivers the required visibility. Sustainable visibility
• Clear accountability and statistical performance analysis. results in operations teams and management being able to use
data dashboards to identify opportunities for improvement and
Data dashboards allow for informed decisions to be made, grow the culture of continuous improvement in the organisation.
resulting in improved delivery and efficiency in an operations
environment. The continuous tracking of performance across 1. Clear objectives. Data dashboards are a tool to
the operations value chain enables immediate action to be enable operational improvement; therefore, when developing
taken where there are constraints or to proactively resolve dashboards, a clear objective for what the tool needs to deliver
business disruptions before they occur. The continuous tracking must be defined. While developing the dashboard, the objective
of operations performance and actioning constraints in the will always be a guiding beacon to ensure the development and
value chain results in a culture of continuous improvement and final product meets business requirements. An example of a
innovation. clear objective is using data dashboards to reduce inventory
levels across an organisation’s central distribution centre (CDC)
How will your business benefit from data and network of regional warehouses.
dashboards?
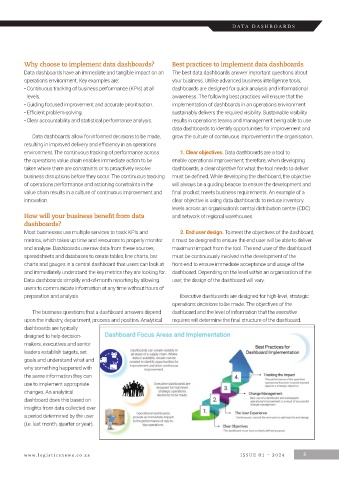
Most businesses use multiple services to track KPIs and 2. End user design. To meet the objectives of the dashboard,
metrics, which takes up time and resources to properly monitor it must be designed to ensure the end user will be able to deliver
and analyse. Dashboards use raw data from these sources, maximum impact from the tool. The end user of the dashboard
spreadsheets and databases to create tables, line charts, bar must be continuously involved in the development of the
charts and gauges in a central dashboard that users can look at front-end to ensure immediate acceptance and usage of the
and immediately understand the key metrics they are looking for. dashboard. Depending on the level within an organisation of the
Data dashboards simplify end-of-month reporting by allowing user, the design of the dashboard will vary.
users to communicate information at any time without hours of
preparation and analysis. Executive dashboards are designed for high-level, strategic
operations decisions to be made. The objectives of the
The business questions that a dashboard answers depend dashboard and the level of information that the executive
upon the industry, department, process and position. Analytical requires will determine the final structure of the dashboard.
dashboards are typically
designed to help decision-
makers, executives and senior
leaders establish targets, set
goals and understand what and
why something happened with
the same information they can
use to implement appropriate
changes. An analytical
dashboard does this based on
insights from data collected over
a period determined by the user
(i.e. last month, quarter or year).
www .l o g ist i csn e w s .c o .z a I S S UE 01 – 2024 3